This post was researched and written by our excellent RD volunteer, Sarah Dales, and edited by Anneke Hobson! Thank you Sarah!
Coffee is one of the most widely consumed beverages globally and a major agricultural product. Worldwide, over a billion people drink coffee daily. If this includes you, you might have thought about its health benefits and how you respond to it (does it give you the jitters or a desired boost in alertness and energy?). You may have even considered the climate impacts of what you put in your coffee, but have you wondered about the climate impacts of coffee itself? We got curious, and looked into the climate impacts of coffee, including where greenhouse gases are generated in its supply chain.
Coffee consumption began in Ethiopia and subsequently spread to Yemen, and then beyond, around the 6th century. Today production is concentrated in tropical countries, as coffee grows best around the equator, and it provides a key source of income for millions. Brazil has been far and away the largest producer of coffee for many years (38% of global production), with Vietnam in second place (17%), followed by Colombia (7%).
While there are at least 125 species of coffee, two species are economically important and represent the vast majority of global coffee production: coffea arabica and coffea robusta. C. arabica is the most studied in terms of climate impact, and accounts for about 70% of global coffee production. Worldwide, coffee production has been continuously increasing over the past decade, and is expected to double by 2050 to meet demand.
With this growing demand, we should have a good sense of the climate impacts of this crop. As we’ve done with other foods, the graphic below (based on data collected by Poore and Nemecek) gives us a snapshot of where coffee falls on the spectrum of average greenhouse gas (GHG) emissions across different food supply chains.
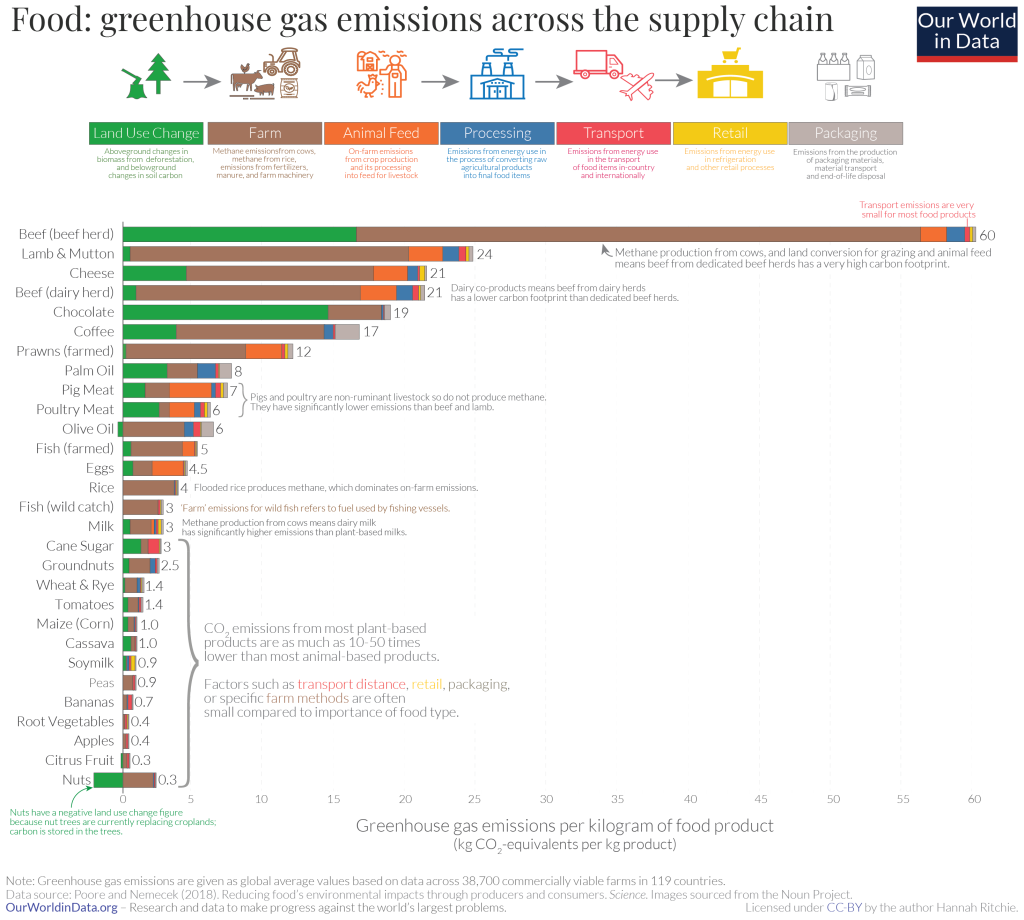
As you probably know by now, this data shows GHGs per kilogram of food produced. You’ll see coffee sitting near the top of the list as a higher GHG emitter. Within the coffee supply chain, the greatest contribution of emissions are from “farm”, followed by “land use change”, and then a pretty small amount coming from “packaging.” Given this, increases in production to meet growing demand has the potential to worsen deforestation and land use change, impacting biodiversity and climate change.
On the flip side, coffee (especially C. arabica) is itself quite climate sensitive. Its production is already being impacted by a warming climate and less, more variable rainfall. This results in stressed coffee trees that can provide poor yields and lower quality beans, which in turn, leave them susceptible to coffee bean diseases and pests. So, while demand may continue to increase, some studies have predicted that by 2050, the amount of land suitable for coffee farming may shrink by 48-97% in key regions.
Two things to note about the graphic above:
1. The data above is for one kilogram of roasted beans. This is the equivalent of a Costco-sized bag of beans, which makes roughly 56 espressos, or maybe around a month’s worth of espressos, depending on your consumption. Not an espresso drinker? Then keep in mind that different brewing methods require different amounts of beans (cold brew requires more, while drip coffee needs somewhat less). Now compare that with the number of servings from something like 1kg of beef (beef herd) – about nine 4oz servings, or 1kg of milk – about 4 cups (250ml). So, at the individual level, serving size is an important factor to consider in terms of the resulting emissions.
2. The above graph only shows part of the story as it doesn’t include impacts in the “consumption” phase. “Consumption” includes brewing method, washing (cups, etc.) and waste. By some accounts, this phase contributes up to 50% of coffee’s full (cradle-to-grave) carbon footprint.
Now, while life-cycle assessment (LCA) is generally considered the “gold standard” for assessing a food’s emissions across the supply chain, their application to coffee is considered more limited. There is significant variation in agricultural practices used to grow coffee; where the coffee is grown can drastically change the GHG emissions; and differences in the size of the coffee operation adds another, not well characterized, difference. Variability in emission calculation methodologies is another noted area for variability. So while average emissions from producing 1kg of roasted coffee beans is 17-20kg Co2e, the range has been estimated to be 3-40+kg!
Despite these inconsistencies, LCAs have shown that the main contributors to the global warming potential of coffee beans tends to be from before they leave the farm. The “hotspots” in the supply chain are typically due to
- Land use change and deforestation: clearing forests for coffee plantations releases stored carbon into the atmosphere
- Fertilizers: use of nitrogen-based fertilizers contributes to GHG emissions
- “Wet processing” (sorting and cleaning the beans): generates wastewater rich in organic matter that emits methane (when untreated)
The below image (from Villagomez et al. 2022) shows a range of GHG emissions from each stage of the coffee supply chain.
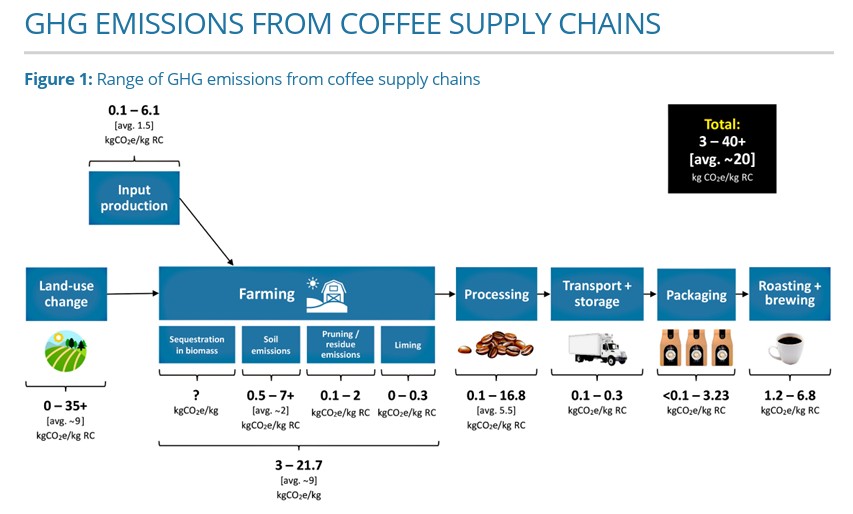
Interestingly, while transport doesn’t stand out as a significant contributor to GHG emissions (consistent with findings for most foods where transport accounts for less than 10% of GHGs) some studies have found approximately 15% of coffee’s GHG emissions are attributed to international transport. This is due to the use of air-freighting in some supply chains. Following from this, one study found that for C. arabica grown in Brazil and Vietnam and exported to the United Kingdom, changing transportation method from freight plane to cargo ship has the ability to reduce coffee’s carbon footprint considerably. However, this change results in a significantly increased time to transport (from less than a day to 2-3 weeks, depending on country of origin), but it also allows a much larger shipment–trade-offs that importers will be weighing.
And while “sustainable” is not a standardly defined term, it is typically used to signify improvements made in various stages of a coffee’s life cycle to address environmental concerns, and/or social and economic issues. For example, many sustainable coffee producers use agroforestry plots that have the ability to hold 3-4 times more carbon than unshaded monocultures.
There are five main certifications relevant to coffee sustainability: Fair Trade, The Rainforest Alliance, Organic, Eco-OK and UTZ. While these certifications are not perfect, they provide some assurances that steps are being taken to improve coffee’s environmental impact. Nespresso and Starbucks also have independent sustainability schemes, and some have actually estimated these to have a significantly larger impact due to specific focus on reducing GHG emissions and working with their suppliers to make targeted changes.
Beyond the farm, the “consumption” stage has the next greatest environmental impact. This is largely due to brewing method, but also washing and waste. Retail packaging is a small contributor to GHG emissions, with the exception of single-use pods, especially if they’re not recyclable/compostable.
Within brewing method, GHGs can vary significantly depending on the system. For example, french press filters produce fewer emissions versus automatic coffee machines that heat the water and then keep it warm. Nespresso conducted their own LCA (see graphic below) comparing a lungo made in their system to an equivalent amount of coffee in others systems and found using a “fully automatic” machine results in the highest emissions (by approximately 23%).

And you may have already guessed that what you add to your coffee is an important factor to your coffee’s carbon emissions, as you can see in the image below (from Nab,C and Maslin, M. 2020). While the way beans are grown is a key factor, so is the amount and type of milk added.

As coffee consumers, if you want to make choices to lower your coffee-related carbon footprint, you’ll get the best bang for your buck by choosing beans that have been certified as grown sustainably. Beyond that you can:
- Add non-dairy milk instead of dairy (or drink your coffee black)
- Choose coffee beans that have been roasted in their country of origin (this makes them lighter during transport, so less fuel is used to transport the same amount of coffee) rather than locally/freshly roasted
- Choose coffee brands that offer compostable/recyclable pods or recyclable bags
- Use an electric coffee machine that automatically powers down or is energy-star-rated
- Compost leftover coffee grounds (can be a nutrient-rich addition to your garden!)
Write to us with your thoughts, questions, and any changes you’re thinking of making based on this summary!
References
Agricultural Production Standard Version 1.2.0. published by Fair Trade USA, effective January 1, 2022. Accessed from https://assets.fairtradecertified.org
Brewing a Sustainable Future: The Carbon Footprint of Your Coffee (6 April 2025). Retrieved 10Jun 2025 from https://cdp.net/en/insights/brewing-a-sustainable-future-the-carbon-footprint-of-your-coffee
Cheron-Bessou, C., Acosta-Alba, I., Boissy, J., Payen, S., Rigau, C., Setiawan, AAR., Sevenster, M., Tran, T. and Azapagic, A. (2024). Unravelling life cycle impacts of coffee: Why do results differ so much among studies? Sustainable Production and Consumption, vol 47, June 2024, pages 251-266. Retrieved from: https://www.sciencedirect.com/science/article/pii/S2352550924001027
Hannah Ritchie (2020) – “You want to reduce the carbon footprint of your food? Focus on what you eat, not whether your food is local” Published online at OurWorldinData.org. Retrieved from: ‘https://ourworldindata.org/food-choice-vs-eating-local’ [Online Resource]
Krishnan, S. (2017). Sustainable Coffee Production. Oxford Research Encyclopedia of Environmental Science. Retrieved 10 Jun 2025, from https://oxfordre.com/environmentalscience/view/10.1093/acrefore/9780199389414.001.0001/acrefore-9780199389414-e-224.
Nab, C. and Maslin, M. (2020). Life cycle assessment synthesis of the carbon footprint of Arabica coffee: Case study of Brazil and Vietnam conventional and sustainable coffee production and export to the United Kingdom. Geo: Geography and Environment. Vol 7, Issue 2. https://doi.org/10.1002/geo2.96
Production – Coffee (2024) from USDA Foreign Agricultural Service. https://www.fas.usda.gov/data/production/commodity/0711100
Villagomez A, Carvajal F, Silver J, et al. (2022 Sept 19). Measuring and mitigating GHGs: Coffee. The Markets Institute at WWF. https://files.worldwildlife.org/wwfcmsprod/files/Publication/file/2o8dri8jim_MOBERG_GHG_Brief_COFFEE_09_22_v4.pdf
What’s the environmental impact of your cup of coffee? Nestle Nespresso. https://nestle-nespresso.com/sites/site.prod.nestle-nespresso.com/files/NN_EU_LCA_Infographic_Draft17.pdf