I don’t know about you, but I’ve had a lot of conversations recently about the winter we’re having. Clients, friends, family, and strangers I chat with are all noticing the extremely mild, almost snowless season. My 4 year-old keeps saying things like “winter is coming soon” in a hopeful voice, and I’m not sure what to tell her. Like me, you might be wondering how much this is attributable to climate change, and also like me, you might be experiencing anxiety about it. Because I can’t get enough of data visualizations, this month I looked at some numbers to back up and get a sense of where we’re at on climate change and climate action in Canada. You might think that this is a terrible idea, but I find concrete information powerful, and zooming out from the news cycle usually helps my general state of doubt and confusion.
The Canadian government has an excellent series of charts on various environmental indicators, including many on greenhouse gas (ghg) emissions. Below is the main one, showing carbon dioxide equivalents (7 ghgs, including carbon dioxide, methane, and nitrous oxide), and the absolute total amount we are emitting over time:
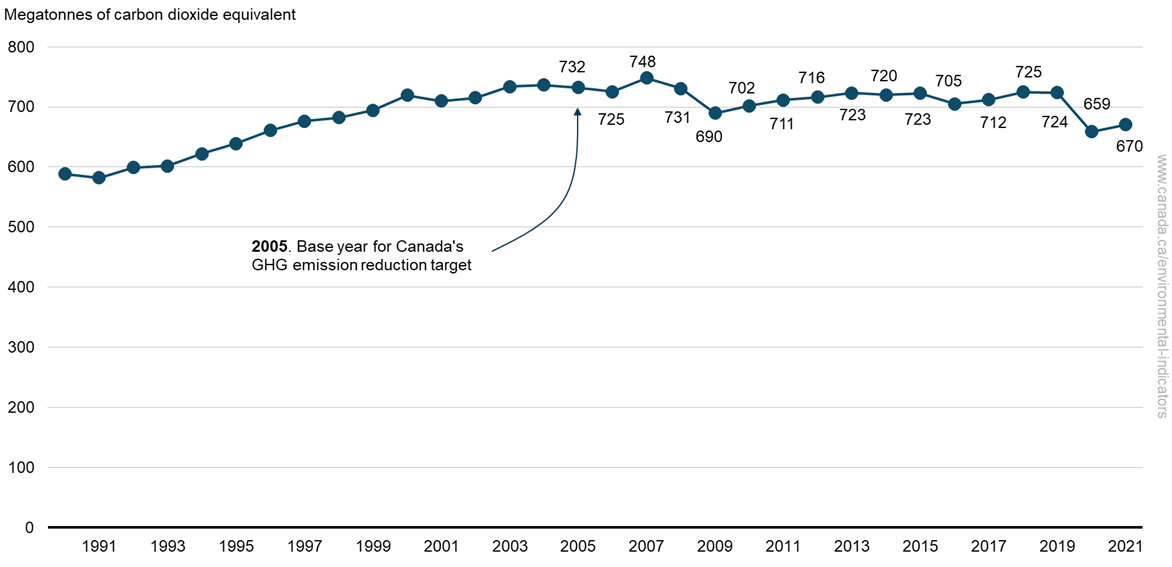
Somehow, this chart surprised me in how stable the total amount has been over the last two decades. You can see that even aside from the lock-down pandemic years in 2019-2021, total ghg emissions have been relatively stable or even declining for a while now, with a peak in 2007.
You might be wondering about a longer timescale of emissions, so here’s a chart showing the total amount for Canada (carbon dioxide emissions only) since before the Industrial Revolution:
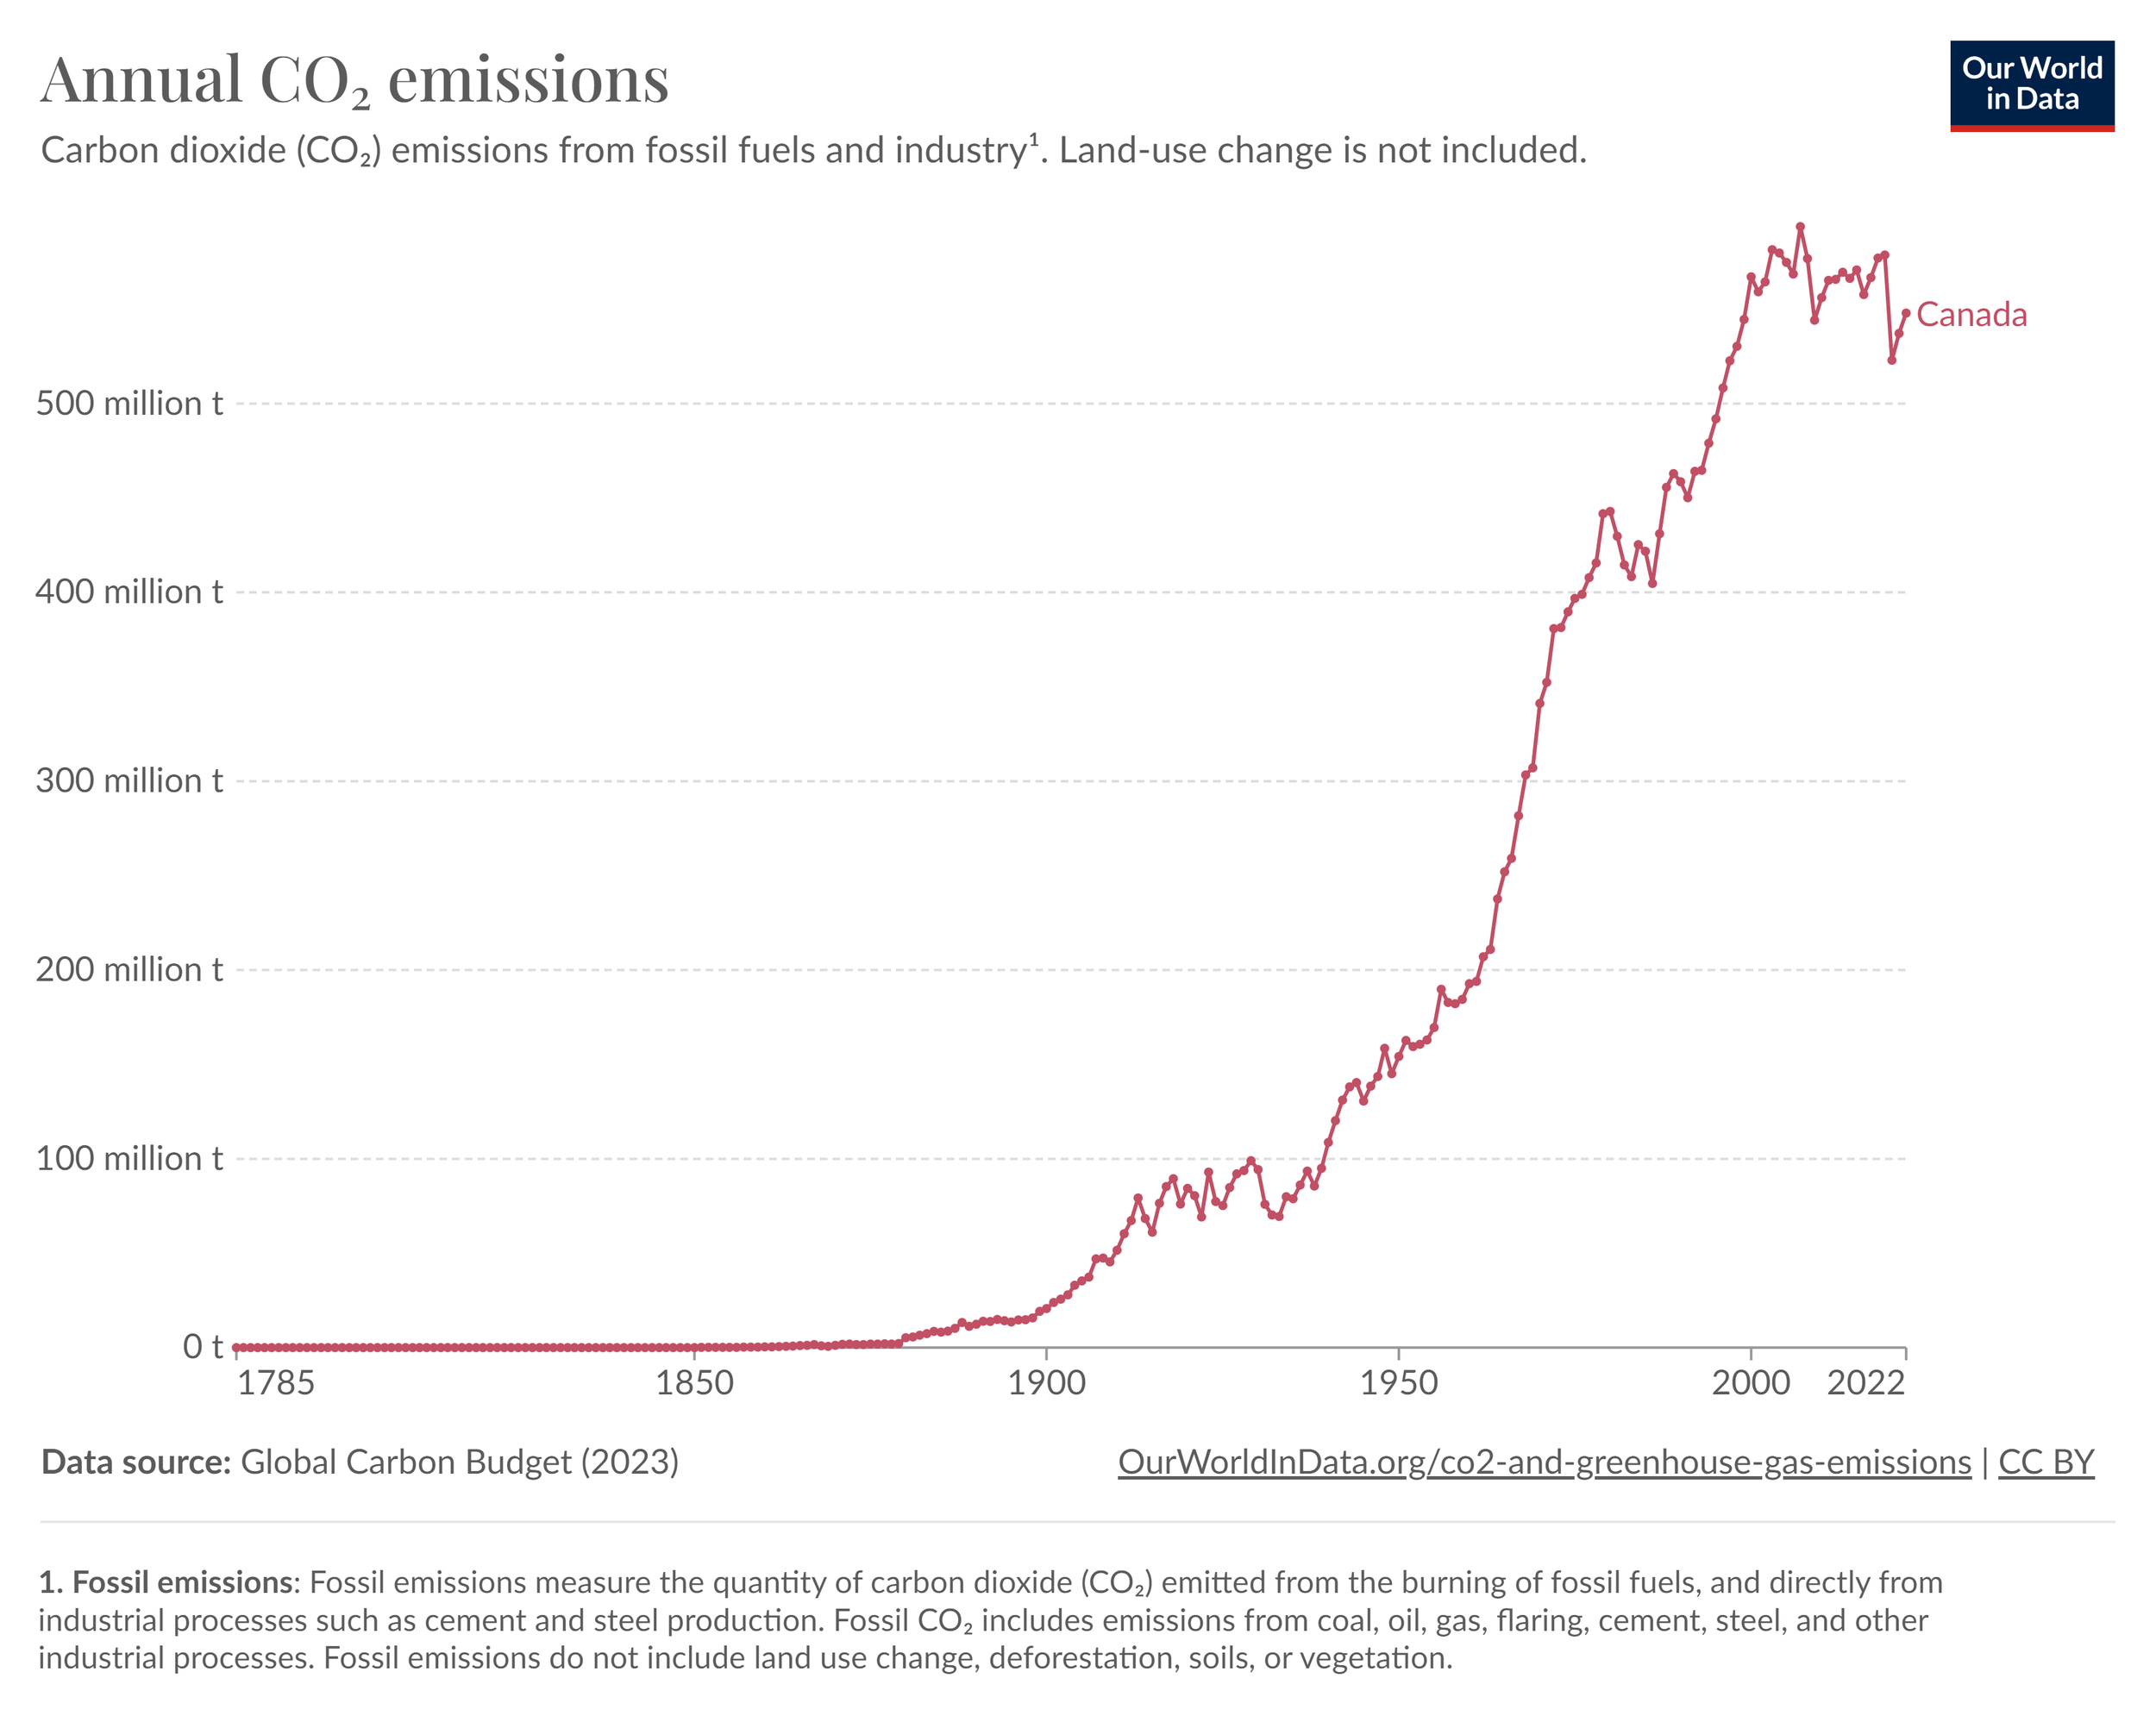
So we are trending in the right direction, and total CO2 emissions peaked a while ago (right around the year 2000), but it’s also a situation that we need to continue to work on and address urgently.
The next interesting and surprising chart is ghg emissions per capita in Canada, and emissions per GDP (gross domestic product):
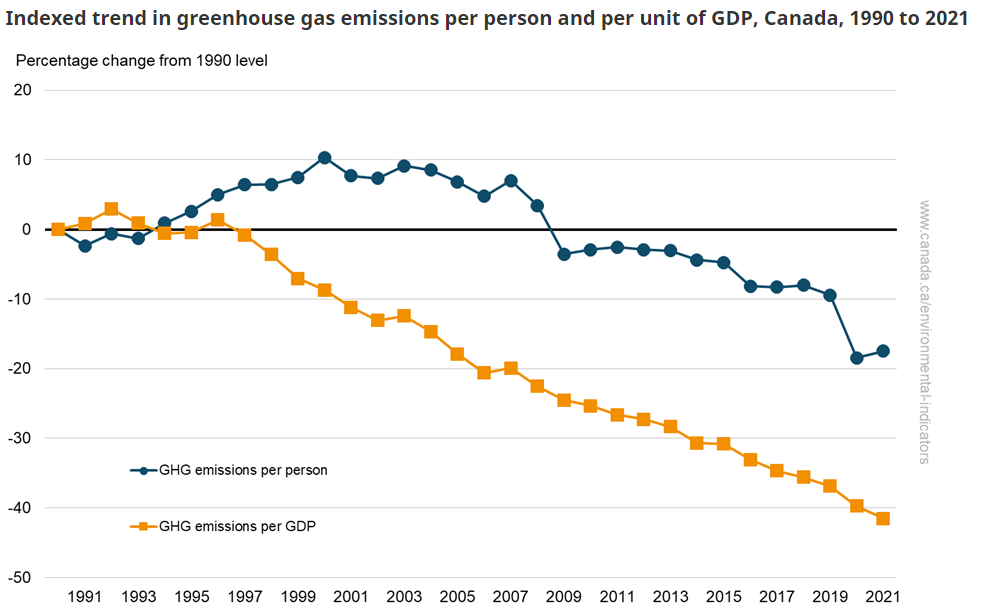
A couple of things really jump out at me from this one. First, per-capita emissions have fallen quite a lot since 1990–almost 20%! They went down especially fast in 2019-2020 during the pandemic, but there’s a declining trend unrelated to that drop. Second, and really significantly for me, is the yellow line showing that emissions per GDP are decreasing. This might seem obscure, but when I first became obsessed with climate change about 15 years ago, the going assumption was that the economy and the environment are directly competing with each other. That is, any economic gains are going to be at the cost of the environment, and any environmental protections or wins are only possible by stopping the economy from growing (or from stopping the human population from growing). This leads to some grim calculations, like trying to convince or coerce people not to have kids, or trying to decide whether we want to lift people out of poverty or save the environment, because you can’t do both. That yellow line above challenges this assumption, and shows that in fact we can reduce ghg emissions and grow the economy at the same time. Sure, sometimes there are decisions to be made between environmental protection and economic growth, but it’s possible to achieve both in a big picture sense. And it’s already happening! Technology, efficiency, and environmental policies are having an effect that is clearly consistent over time.
It’s so good to see Canada’s emissions coming down in a long-term, consistent trend, but it’s also good to remember that we still have the second-highest per-capita emissions in the world:
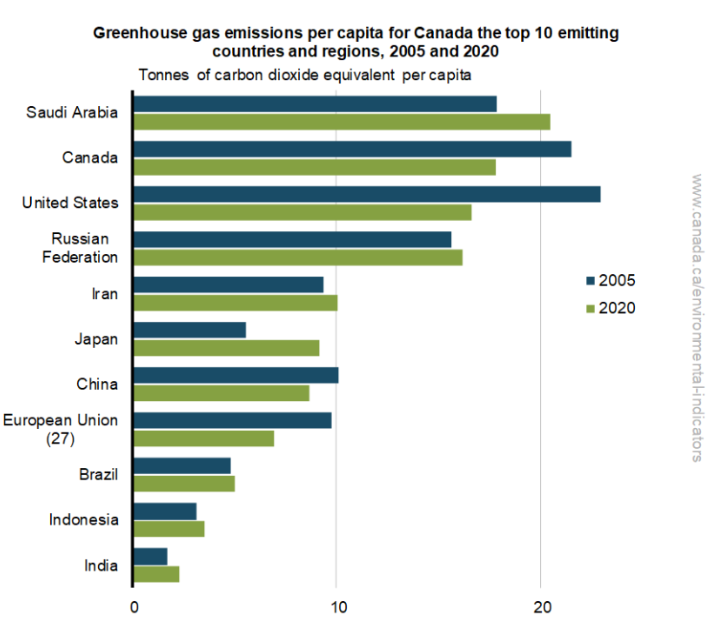
You can see that we’re emitting more per person than in the U.S, and other cold places like Russia. So, we’re on the right track and we’re making progress (the difference between 2005 and 2020 is substantial!), but we have a lot of work to do.
What about in agriculture? Before getting into the data, it’s important to remember that this is only capturing production emissions, and not consumption emissions. This can be confusing and complicated, because we have a globalized food system where some of what Canadian farms produce gets sold to other countries, and what Canadians consume is sourced from around the world. Canadian producers are also relatively efficient (food is produced with a lower amount of ghg emissions compared to producers in other countries).
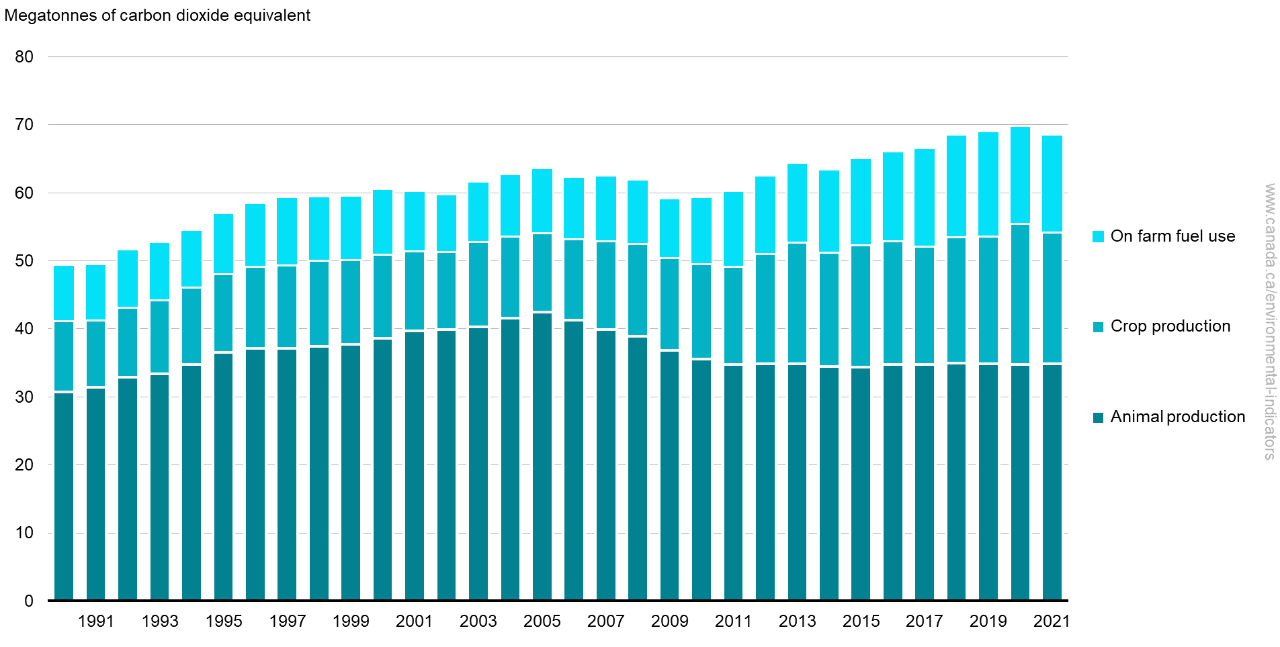
Within Canada’s agricultural emissions, you’ll notice that animal production is still the biggest contributor to the total, and that includes animal production emissions that are actually embedded in “crop production” emissions, because a lot of the crops we grow feed farm animals rather than humans directly. The government website notes that the main reason for the reduction in ghg emissions from animal production is a reduction in cattle populations.
Ok, that’s it for the data update: you can browse around the federal government’s website for more detail on ghg emissions (link cited at the bottom of this post). There’s something special about stepping away from the individual news reports and the back-and-forth commentary that helps me feel like I’m seeing a complex issue more clearly, because it’s actually been measured and put into context (of course it’s possible to manipulate data and context, so looking at it from multiple angles and with a critical eye for bias is key). If you’re familiar with the work of Hans Rosling and Hannah Ritchie, you’ll also know how powerful it can be to lean back and look at longer term trends in health and sustainability.
Attribution science can also help. In terms of this mild winter, for example, El Niño is being noted everywhere as the main driver. But attribution science can help us gauge how much of the warmth is driven by El Niño and how much is caused by human-caused climate change. Climate Central, a scientist-run charity, ran an attribution analysis for the month of December 2023 in Canada, and found that in that month, the El Niño effect was not sufficient to account for the record temperatures we experienced. They found that at least 5 of the warm days in December across Canada were twice as likely to occur due to climate change. Basically, climate change is a significant factor in our warm winter, and the combination with El Niño has made it even warmer.
Take-aways for me:
-
Canada is making progress on ghg emissions
-
Per capita emissions are consistently declining, although we’re still second highest in the world
-
Ghg emissions have decoupled from economic growth, showing that it’s possible (probable, even!) to mitigate climate change while growing the economy
-
Reducing cattle populations still seems to be the quickest and most effective way to reduce agricultural emissions
-
There’s still so much climate action work to do, and it’s urgent
-
Attribution analysis is worth looking at with extreme events, including natural disasters and unusual weather patterns
-
El Niño and climate change are both driving this warm winter
The reason I like the term “impatient optimism” is that it captures a fine line to walk of looking at a situation like climate change realistically, and staying optimistic that it can be solved or at least improved. The other options are doomerism and despair, which are horrible, or blind optimism without looking at it or taking action, which also seems bad. Impatient optimism holds the reality of a situation while also maintaining the view that we should act as effectively and as quickly as possible. So I’m taking this view about the warm winter–it’s bad, but slowly getting better, and I’m impatient about it.
I hope this helped to give you some clarity, and possibly address some climate anxiety out there!
Anneke
References
Climate Central (2024). Analysis: Climate change drove Canada’s warm December. Retrieved from https://www.climatecentral.org/climate-shift-index-alert/climate-shift-index-alert-canada-dec-2023
Environment and Climate Change Canada (2023). Greenhouse gas emissions. Retrieved from https://www.canada.ca/en/environment-climate-change/services/environmental-indicators/greenhouse-gas-emissions.html
Our World In Data (2023). Canada: CO2 Country Profile. Retrieved from https://ourworldindata.org/co2/country/canada